E-Commerce Strategies
Tracking revenue as an Amazon seller can be overwhelming, with over 40 fee types and hundreds of report entries to manage. The right tools can simplify this process, offering real-time insights into profits and expenses. Here are the 7 best tools to help you track revenue, optimize costs, and boost profitability:
Helium 10: Offers real-time profit tracking, inventory heat maps, and FBA reimbursement services. Plans start at $49/month.
Jungle Scout: Features Sales Analytics and AI-powered reports, ideal for sellers scaling operations. Pricing begins at $49/month.
Sellerboard: Budget-friendly, focusing on precise profit tracking and PPC optimization. Plans start at $19/month.
ManageByStats: Includes Amazon Payout tracking and lifetime value metrics. Free and paid plans available.
Nova Analytics: Known for its fast data refresh (every 30 minutes) and high accuracy. Starts at $29/month.
SellerApp: Combines profit tracking with advanced PPC analytics. Pricing starts at $199/month.
ProfitGuru: Focuses on sourcing insights with tools like an FBA calculator and sales estimator. Plans start at $19/month.
Each tool caters to different business needs, from beginner sellers to multi-channel enterprises. Below, explore their features, pricing, and best use cases to find the one that aligns with your goals.
Review of BEST Amazon Profit Tracking Tools for 2025 (incl. Top FREE Software for Amazon Sellers)

1. Helium 10
Helium 10, trusted by over 4.5 million brands, is a platform that simplifies revenue tracking. Its Profits tool offers real-time insights into revenue, net profit, ROI, and profit margins across platforms like Amazon, Walmart, and TikTok Shop. By monitoring orders, units sold, promotions, and refunds, it helps users identify what drives profits and what drains them. Here's a closer look at how Helium 10 turns data into actionable insights.
Monthly Pricing
Helium 10 provides several pricing options to fit varying needs:
A free plan with limited access to essential tools.
The Starter plan at $49/month (or $39/month when billed annually).
The Platinum plan for $129/month ($99/month annually), which includes full access to the Profits dashboard for up to 20 ASINs.
The Diamond plan, priced at $359/month ($279/month annually), adds advanced features like AI-driven advertising automation and inventory management for up to 10,000 SKUs.
All paid plans come with access to the Freedom Ticket training course, a $997 value, providing users with additional resources to optimize their revenue strategies.
Core Revenue Features
The Profits tool offers a comprehensive view of financial performance. Features include:
Inventory heat maps to predict restocking needs based on sales trends, helping avoid stockouts.
The Refund Genie and Managed Refund Service, which automatically recover lost FBA reimbursements.
A simplified profit and loss statement that breaks down costs like COGS and taxes.
Sales trend tracking to guide strategic decisions about product offerings.
These tools work together to provide a clear picture of where your business stands financially and what adjustments might be needed.
Customization Options
Helium 10 allows users to tailor their experience to their specific needs. The Insights Dashboard can be customized with metrics that matter most to your business. Reports are filterable by date ranges, and you can exclude seasonal or discontinued products from FBA export files. The Keyword Tracker's Boost feature provides hourly product ranking updates for 10 days, offering timely insights for advertising strategies.
Best Use Cases
Helium 10 is particularly well-suited for sellers managing multiple products or expanding to platforms beyond Amazon, such as Walmart and TikTok Shop. Its multi-channel dashboard consolidates data, making it easier to oversee operations. Additionally, the automated refund tracking feature is invaluable for recovering hidden revenue, especially as Amazon FBA fees are projected to increase by an average of $0.08 per unit in 2026. For sellers aiming to stay competitive in a crowded marketplace, Helium 10’s advanced tracking and customization tools are indispensable.
2. Jungle Scout

Trusted by 65% of Amazon sellers, Jungle Scout's Cobalt plan reportedly drives an average 28% year-over-year revenue growth. One standout feature, Sales Analytics, acts as a real-time financial dashboard. It organizes Amazon sales data, helping sellers zero in on profit-building strategies while trimming unnecessary costs.
Monthly Pricing
Jungle Scout offers three pricing tiers, with discounts for annual subscriptions:
Starter Plan: $49/month (or $29/month when billed annually) for essential sales and keyword research tools.
Growth Accelerator Plan: $79/month (or $49/month annually) includes full Sales Analytics, 100 AI Assist uses, and Advertising Analytics.
Brand Owner Plan: $149/month (or $129/month annually) adds Competitive Intelligence, 500 AI Assist uses, and access for up to 10 team members.
All plans include a 7-day money-back guarantee and support for up to 19 Amazon marketplaces, allowing sellers to track global revenue seamlessly.
Core Revenue Features
The platform's Profit Overview dashboard offers both a big-picture view and product-specific insights. AI Assist takes it further by generating CFO-level reports that break down revenue, COGS (Cost of Goods Sold), and fees. Sellers can analyze individual ASINs or SKUs, tracking PPC campaign costs and supplier expenses. Professional P&L statements help uncover hidden fees, taxes, and other expenses. Additionally, Jungle Scout compares historical PPC-driven sales with organic sales to evaluate advertising performance at a granular level.
Customization Options
Jungle Scout provides flexibility through custom expense tracking, allowing sellers to log unique costs like salaries, shipping, and legal fees. Users can filter data by custom date ranges and drill down to analyze individual product performance. The AI Assist feature generates personalized financial reports tailored to specific business data, while team management tools let primary users control access to features and data for team members. These options make it easier for sellers to adapt the platform to their unique revenue strategies.
Best Use Cases
Jungle Scout is especially helpful for sellers looking to phase out underperforming products. Its tools can identify low-margin items or products with high return rates. The Inventory Manager predicts FBA sales and profits, helping sellers avoid costly storage fees. Private label sellers can track their Buy Box percentage and spot revenue-impacting issues. Plus, with 75% of online shoppers influenced by reviews and ratings, Jungle Scout's review automation tools can enhance product visibility and drive sales growth.
3. Sellerboard
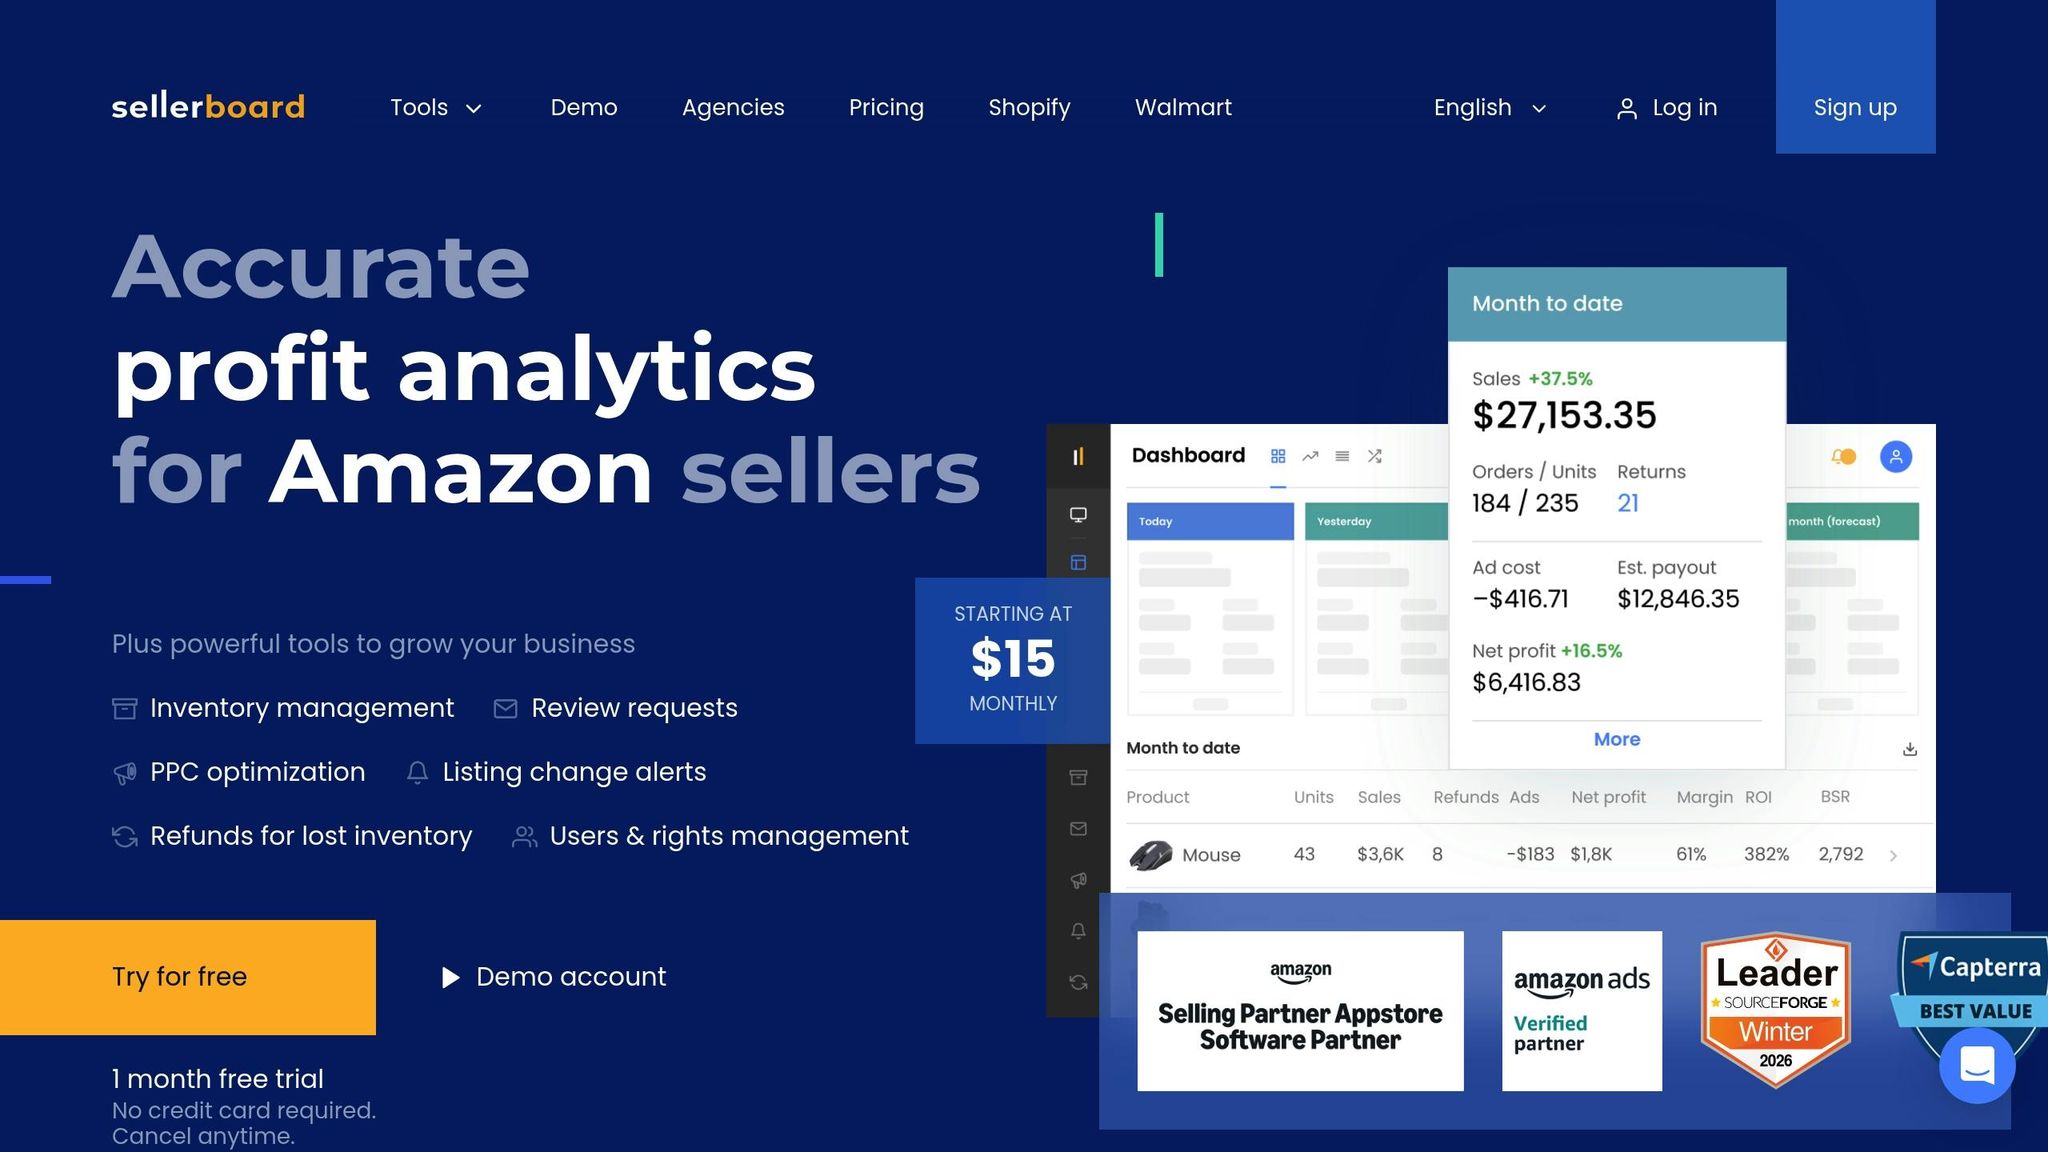
Sellerboard provides a real-time profit dashboard that brings together sales, orders, refunds, and ad costs to deliver an accurate net profit figure. It automatically monitors over 100 Amazon fees, including storage, inbound shipments, remissions, and labeling fees. With a strong 4.6/5 rating from more than 876 verified reviews, users frequently highlight its ability to uncover "hidden" costs that Amazon Seller Central doesn't make obvious.
Monthly Pricing
Sellerboard offers four pricing tiers based on monthly order volume, with a 20% discount available for annual subscriptions:
Plan | Monthly Price | Annual Price | Order Limit |
|---|---|---|---|
Standard | $19/month | $15/month ($179/year) | 3,000 orders |
Professional | $29/month | $23/month ($279/year) | 6,000 orders |
Business | $39/month | $31/month ($369/year) | 15,000 orders |
Enterprise | $79/month | $63/month ($759/year) | 50,000 orders |
All plans include a 30-day free trial, and no credit card is required to get started. Users can also access up to 12 months of historical data to evaluate long-term product performance.
Core Revenue Features
Sellerboard offers several tools to help sellers optimize their revenues:
PPC profitability analysis connects ad spend to product margins, showing the net profit impact of campaigns and keywords. It supports three COGS methods - FIFO, batch-based, and period-based - for precise calculations.
A detailed returns and refunds breakdown highlights non-refundable FBA fees and the cost of unsellable items.
The Money Back report pinpoints lost or damaged inventory eligible for Amazon reimbursement. Many users report recovering their subscription costs within a single month.
Cashflow forecasting predicts future cash availability by factoring in payouts, expenses, and inventory purchases.
"sellerboard makes it so easy to know your numbers that I really can't imagine ever selling on Amazon without it." - Nikki Kirk, Amazon Seller
Customization Options
Sellerboard offers five dashboard views to suit different needs: Tiles (snapshot), Chart (trends), P&L (detailed breakdown), Map (geographic), and Trends (performance trajectory). These views can be filtered by product name, SKU, ASIN, or custom tags, allowing sellers to dive deep into specific brands or product lines. The Chart view is especially flexible, enabling users to overlay metrics like sales and ad spend over custom time intervals (daily, monthly, or custom ranges).
The platform also tracks indirect expenses, such as office rent or virtual assistant costs, and integrates them into net profit calculations. Higher-tier plans allow account owners to restrict user access by specific functions, marketplaces, or product sets.
Best Use Cases
Sellerboard is particularly well-suited for sellers who need precise FBA reimbursement tracking while staying budget-friendly. Its built-in autoresponder sends compliant review requests, which can help improve organic rankings and boost revenue. Alerts for changes like Buy Box losses or fee adjustments ensure sellers can act quickly to protect their margins.
For those managing multiple marketplaces, Sellerboard supports selling across multiple channels for Amazon, eBay, and Walmart, all within a single dashboard. It also integrates seamlessly with tools like QuickBooks for automated accounting and ShipStation for syncing actual shipping costs.
4. ManageByStats
ManageByStats is a powerful tool designed to help Amazon sellers track revenue with precision. By connecting directly to Amazon's API, the platform monitors 467 million transactions and $250 million in monthly sales across 3,000+ users. One of its standout features is the ability to differentiate between Product Sales Revenue (total revenue before discounts) and Net Revenue (revenue after discounts). This distinction is essential for sellers running aggressive promotions who need a clear picture of their actual earnings.
Monthly Pricing
ManageByStats offers three pricing plans, including a feature-packed free option:
Plan | Monthly Price | Seller Accounts | Keyword Tracking | Data Sync History |
|---|---|---|---|---|
Carbon6 Free | $0 | 4 | 100 keywords | 12 months |
MBS Pro | $59.97+ | 8 | 250 keywords | 12 months |
MBS Enterprise | Custom | 12+ | Advanced | 24 months |
The free plan includes unlimited review automation, KPI dashboards, and inventory management. Pro and Enterprise plans add advanced features like expense tracking, competitor analysis, and repeat purchase metrics.
Core Revenue Features
ManageByStats simplifies revenue tracking with its Amazon Payout metric, which calculates your net deposit after factoring in discounts, fees, and shipping costs. This eliminates the need for manual reconciliation. Additionally, the platform tracks Product Lifetime Value (LTV) and repeat purchase rates, helping sellers determine acceptable customer acquisition costs for sustained profitability.
The tool also calculates Cost of Goods Sold (COGS) based on assigned cost data and pairs it with product-level performance metrics. With KPI Smart Notifications, sellers receive alerts for critical changes in revenue, reviews, or inventory levels, allowing for quick action to resolve potential issues.
"ManageByStats saves me hours every day as my go-to Amazon Seller performance dashboard. Now that I'm a few months in, I couldn't imagine running my business without it." - Joey Shepp, CEO, DailyNutro
These features are designed to fit seamlessly into a customizable interface.
Customization Options
The platform offers a range of customization options to fit individual business needs. With the Product Grouping feature, sellers can organize dashboards by product or product groups. This ensures that high-performing brands are analyzed separately from experimental ones, preventing skewed profit data. The Manual Adjustments tool allows users to input costs like taxes, Amazon marketing services, or overhead expenses that Amazon's API doesn't automatically track, ensuring accurate profit calculations.
Enterprise-tier users benefit from additional features like white-label client reporting with custom branding and a dedicated account representative. All plans support multi-account and multi-marketplace management, enabling sellers to monitor activity across the US, Canada, Mexico, the UK, and other international marketplaces from a single dashboard.
Best Use Cases
ManageByStats is especially useful for sellers managing multiple accounts or marketplaces who need detailed payout reconciliation without navigating Seller Central. Its ability to differentiate between "Quantity Ordered" (includes pending orders) and "Quantity Paid For" (shipped and paid orders) provides a clearer view of actual cash flow. For budget-conscious sellers, the free plan's unlimited review automation is a great way to boost organic rankings while reducing manual effort.
"We love it because it connects to Amazon directly and puts all the important data we need into one easy-to-use interface." - Henry C., Amazon Seller
5. Nova Analytics

Nova Analytics stands out among Amazon seller tools with its quick refresh rate, updating data every 30 minutes. This near real-time tracking gives sellers a significant edge, allowing them to respond to changes like Buy Box losses or sudden sales spikes within the hour. While most tools only sync data once or twice a day, Nova’s frequent updates ensure you’re always in the loop. The platform also tracks over 200 Amazon fee types and calculates net profit with an impressive 99.8% accuracy.
Monthly Pricing
Nova Analytics offers pricing plans based on order volume, making it a great fit for sellers at various stages of growth:
Plan | Monthly Price | Order Limit | Seller Accounts | Team Seats |
|---|---|---|---|---|
Entry | $29 | Up to 500 orders/mo | 1 | Basic |
Starter | $49 | Up to 3,000 orders/mo | 3 | 6 |
Professional | $99 | Up to 10,000 orders/mo | 5 | 10 |
Scale/Enterprise | $199+ | Custom/High Volume | Custom | Custom |
Every plan comes with a 14-day free trial, no credit card required. Plus, if you choose an annual payment plan, you’ll save 20% across all tiers.
Core Revenue Features
Nova Analytics simplifies profit tracking with its Product-Level P&L, which dives into the profitability of individual SKUs. This feature helps sellers identify which products are genuinely driving profits versus those just adding to revenue. Factors like Cost of Goods Sold (COGS), advertising spend, and refunds are automatically integrated into the P&L view, eliminating the need for manual calculations.
The platform also supports Multi-Marketplace Consolidation, pulling data from major Amazon marketplaces - including the US, UK, EU, Canada, Japan, and Australia - into one centralized dashboard. This eliminates the hassle of switching between multiple Seller Central accounts. Additionally, sellers can compare daily and monthly trends to spot seasonal shifts or underlying issues, while refund tracking highlights product-specific return rates to safeguard margins.
Customization Options
Nova’s flexibility is another big plus. Its customizable dashboard allows users to organize components in a way that suits their workflow. You can also set up custom KPIs to track metrics that go beyond basic revenue. With custom views, team members can focus on specific business segments - whether it’s a particular brand or marketplace performance. Professional and Enterprise plans even include advanced options like custom tracking views and exportable reports.
Best Use Cases
Nova Analytics shines for sellers managing $10,000–$100,000 in monthly revenue who need to identify underperforming SKUs before they drain resources. For brands generating $100,000–$1 million monthly, the platform’s historical comparison tools are invaluable for seasonal planning and monitoring velocity across regions. Agencies working with multiple client accounts will appreciate features like consolidated sales feeds and segmentation by custom tags, brands, or marketplaces. And thanks to its 30-minute refresh rate, Nova is perfect for sellers who need to address inventory or pricing issues without waiting for end-of-day reports.
6. SellerApp

SellerApp stands out by blending profit tracking with advanced ad analytics, providing a clear picture of how PPC impacts your overall earnings. With data from 1.2 billion data points across 14 global marketplaces - including the US, UK, Canada, UAE, India, Australia, Japan, and parts of Europe - it caters to a wide range of Amazon sellers. Over 9,000 sellers currently use SellerApp, and many report an 84% reduction in time spent on manual profit and loss calculations.
Monthly Pricing
Plans for SellerApp start at $199 per month, with tiered options ranging from Essential to Pro and Business. Each plan is tailored to sellers at various revenue levels, with higher tiers offering perks like expert consultations and advanced automation tools. A 7-day free trial is available, complete with personalized onboarding, so you can test the platform before committing.
Core Revenue Features
SellerApp’s real-time dashboard consolidates key metrics like gross revenue, net profit, ROI, and margins, both at the account and SKU levels. It automatically calculates all Amazon fees - covering referral, FBA, storage, and shipping costs - giving you a comprehensive view of your expenses. The platform also tracks TACOS (Total Advertising Cost of Sales) alongside ACoS, offering insights into how ad spending affects your overall business health, not just individual campaigns.
The SKU-Level Profitability tool highlights which products are driving profits versus those that may be draining resources. Additional features include monitoring refunds and returns, analyzing customer behavior (like repeat purchase rates and geographical sales trends), and inventory forecasting based on profit potential rather than just sales volume. Unlike Amazon’s standard 60-day reporting window, SellerApp retains data for the lifetime of your account, enabling long-term trend analysis.
Customization Options
SellerApp allows manual entry of Cost of Goods Sold (COGS) and other operating expenses, ensuring precise net profit calculations. Custom automation rules for PPC campaigns - such as bid adjustments, negative keyword matching, and dayparting - help you manage ad spend more effectively. Personalized alerts keep you informed about listing hijacks, Buy Box changes, price shifts, and BSR updates, ensuring you’re always in the loop.
"What took me 12 to 14 hours before only takes 2 to 3 hours now that I'm using SellerApp's Amazon PPC Analyzer. The PPC Analyzer has allowed us to track, manage, and organize ads in a more efficient way than I ever thought was possible." - Pete Smith, 7-Figure Amazon Seller
Best Use Cases
SellerApp is ideal for sellers who want to see the bigger picture of how advertising impacts overall profitability. If you’re managing multiple marketplaces, the platform’s 14-marketplace integration simplifies reporting, eliminating the need to toggle between multiple Seller Central accounts. Its AI-driven sales forecasting identifies seasonal trends and helps set realistic sales targets, making it especially useful for brands planning inventory around demand spikes. For those investing heavily in PPC, features like TACOS tracking and automated bid adjustments ensure ad spend is optimized without sacrificing profit margins. These capabilities make SellerApp a standout tool for revenue tracking and marketplace management.
7. ProfitGuru
ProfitGuru brings a fresh perspective to revenue tracking by focusing on the sourcing phase of your business. Instead of concentrating solely on post-sale accounting, it provides valuable pre-sale insights, helping sellers estimate profits during product research. With a database of over 900 million Amazon products and access to more than 4,000 verified suppliers, it’s an excellent tool for identifying profitable products before committing to inventory. Currently, it’s tailored specifically for the Amazon US marketplace, making it a highly focused resource for domestic sellers.
Monthly Pricing
ProfitGuru offers flexible pricing options to suit different needs:
Free Plan: $0/month – Includes 10 requests per day, an FBA calculator, and basic searches.
Professional Plan: $50/month (or $40/month when billed annually) – Includes bulk analysis for up to 100,000 UPCs, tracking for 1,000 keywords, and the ability to export up to 1,000 ASINs.
Additional Tiers: Starter ($19/month), Premium ($39/month), Elite ($49/month), and Platinum ($129/month), with features like API access and priority support scaling with each level.
Core Revenue Features
ProfitGuru offers several tools to streamline revenue estimation and sourcing:
FBA Calculator: Calculates net profit per unit after factoring in all Amazon fees, a critical feature given the potential for fee increases to impact margins.
Sales Estimator: Projects monthly revenue based on sales velocity and Best Seller Rank (BSR), helping you forecast earnings before making purchasing decisions.
Bulk Analysis: Processes large supplier files to identify profitable products efficiently, saving time compared to manual ASIN checks.
Market Intelligence: Benchmarks your performance against competitors.
Storefront Stalker: Analyzes top-performing competitor products in your niche to uncover new opportunities.
Customization Options
ProfitGuru goes beyond standard calculations with features that allow you to tailor the tool to your business needs:
Bulk Analysis: Upload supplier files to quickly analyze large datasets.
Custom Tags: Group and track specific products or niches for better monitoring over time.
Historical Data: Access price trends, BSR history, and seller counts to evaluate long-term revenue potential and avoid seasonal pitfalls.
Listing Quality Score (LQS): Identifies high-demand products with poor listings, offering opportunities for private label sellers to improve and compete in those markets.
Best Use Cases
ProfitGuru is particularly suited for wholesale and online arbitrage sellers who deal with large volumes of product data.
Use the FBA Calculator during sourcing to ensure products meet your profit margin goals before purchasing.
The Sales Estimator helps prevent overstocking or understocking by forecasting monthly revenue based on sales volume.
Historical data on BSR and pricing ensures you invest in products with year-round demand, avoiding seasonal traps and unnecessary storage fees.
For private label sellers, the LQS highlights poorly optimized listings, giving you a chance to fill gaps in the market.
Tool Comparison Table

Amazon Revenue Tracking Tools Comparison: Features, Pricing & Best Use Cases
Compare the features, pricing, and customization options of top revenue tracking tools for Amazon sellers with the table below. It highlights essential details to help you evaluate which tool fits your needs based on your priorities.
Tool | Starting Price | Main Features | Customization | Ideal For |
|---|---|---|---|---|
Helium 10 | $29/month | Profits dashboard, Market Tracker, Keyword Tracker, Adtomic PPC manager | High (Insights Dashboard with custom views) | Advanced sellers earning $1M-$5M+ who need an all-in-one suite |
Jungle Scout | $29/month | Sales Analytics, AI-powered reports, Product Database | Moderate | Beginners and intermediate sellers; annual plans offer savings of up to 40% |
Sellerboard | $19/month | Real-time P&L per SKU, PPC Dashboard, Inventory tracking, Automated refunds | High (Customizable tiles and charts) | Cost-conscious sellers earning $500K-$2M focused on profit margins |
ManageByStats | Free / $59.97/month | Customer Database, Catapult Suite, P&L tracking | High (Product groups by brand or supplier) | Sellers managing multiple brands or product lines |
Nova Analytics | $35/month | Near real-time data (hourly refreshes), 99.8% accuracy across 40+ fee types, Custom KPIs | High (Custom P&L views by brand, supplier, or marketplace) | Sellers earning up to $30K monthly revenue who need precise fee tracking; includes a 14-day free trial |
SellerApp | $97/month | Predictive analytics, PPC performance monitoring, Data-driven growth insights | Moderate | Sellers looking for advanced analytics and profit margin optimization tools |
ProfitGuru | Varies | Product research, Competitor analysis | Moderate | Sellers focused on niche markets and competitor data |
Use this table to pinpoint the tool that best matches your revenue tracking goals before diving into the final recommendations. You can also check out our Amazon SEO guide to further improve your product visibility.
Conclusion
Picking the right revenue tracking tool hinges on matching your business's size and complexity with the features you need. For sellers handling fewer than 500 orders per month and seeking straightforward profit tracking, tools like Sellerboard or Jungle Scout are great starting points. On the other hand, if you're managing multiple brands or sales channels, ManageByStats or Nova Analytics offer the flexibility to break down data by supplier, marketplace, or product line.
However, even the best tool won't help if you fall into common traps. One major misstep is focusing too much on price while overlooking functionality. For example, a budget-friendly tool that doesn’t sync in real time can lead to inventory errors or overselling - both of which risk Amazon account suspensions. Consider this: In December 2025, PartyMachines transitioned from manual QuickBooks entries to Webgility. This move not only saved them 8–16 hours per month but also gave them real-time insights into SKU-level profitability across their channels.
Before you choose, take a moment to evaluate your needs. How many orders do you process each month? Are you juggling multiple sales channels? Is month-end reconciliation consuming too much of your time? For solo sellers earning under $500,000 annually, simplicity and affordability should be your priorities. Meanwhile, larger brands with high sales volumes will benefit from tools that integrate seamlessly with accounting software and support multi-channel operations. Your answers will guide you toward the right solution.
Once you've selected a tool, the next step is to integrate it effectively. Customize your dashboard to focus on the metrics that matter most - like TACoS, SKU margins, or restock alerts. Sync the tool directly with your accounting software to eliminate manual data entry. As Levi Adler, Founder of Levi's Toolbox, puts it:
"In my experience, once you start using proper analytics and really tracking your data, it changes how you run your business. You stop guessing and start setting goals and making decisions based on actual data."
With Amazon FBA fees increasing, having real-time tracking in place is vital for spotting profit leaks and fine-tuning ad spend in today’s competitive environment. By choosing a tool that fits your business size and needs, you’ll safeguard your margins and make smarter, data-driven decisions.
FAQs
Which tool fits my monthly order volume?
When it comes to picking the right tool, it really depends on how much you're selling and what your business needs. If you're handling high sales volumes, tools like Lightspeed or Helium 10 Profits can provide real-time data and deep analysis to help you stay on top of things. For those with moderate sales volumes, Analyzer.tools is a solid choice, offering bulk analysis starting at $29 per month. If you're a smaller seller, free options like Jungle Scout or Helium 10’s sales estimator can give you quick, helpful insights without breaking the bank. The key is to choose a tool that aligns with your business size and the type of data you need.
What fees and costs should I track for true net profit?
To determine your actual net profit, it's essential to keep tabs on various expenses, including Amazon referral fees, fulfillment charges, storage costs, return processing fees, inbound placement expenses, and advertising costs (PPC). Keeping an eye on these ensures you're factoring in all deductions that impact your overall profit.
How do I connect revenue tracking with my accounting and PPC data?
To link revenue tracking with accounting and PPC data, you can use tools that merge sales, advertising, and financial information seamlessly in real time. For accounting, QuickBooks Online is a go-to platform that makes financial reconciliation easier. On the PPC side, analytics tools help you dive into ad spend and assess campaign performance. These integrations create smoother data flows, giving you precise, up-to-the-minute insights into how your business is performing.