E-Commerce Strategies
Running ads across Amazon marketplaces? Here’s the key: tracking global ad metrics helps you manage campaigns in one dashboard, compare performance across regions, and optimize for better results. Metrics like CTR (0.59%), CVR (11.55%), and ROAS (2.4) reveal what’s working and where to adjust budgets or bids.
Key takeaways:
Impressions & CTR gauge visibility and engagement. Average CTR is higher on mobile (65% of clicks).
Conversion Rates differ by region and price. Lower-priced items convert better (12.50%).
Profitability Metrics like ACoS (32.48%) and ROAS highlight ad efficiency. Aim for ROAS above 3:1.
Tools like Search Term Impression Share and New-to-Brand metrics help refine targeting and attract new customers.
Tailor campaigns per region. For example, US shoppers search for "comforters", while UK users look for "duvets." Adjust keywords, bids, and creatives to fit local trends. Tools like Amazon Attribution and expert services can simplify management, saving time and boosting results.
Bottom line: Use data to identify high-performing regions, cut waste, and grow internationally with precision.
Scale Your Amazon Ads Internationally: Global Selling and PPC Strategies from Amazon Ads Team
Core Metrics for Measuring International Ad Performance
2026 Amazon Global Ad Metrics Benchmarks and Performance Standards
Tracking the right metrics is what separates successful campaigns from those that fall short. When advertising across regions like the US, UK, or Australia, these essential metrics help you pinpoint where your ad budget is working - and where it’s not.
Impressions, Reach, and Click-Through Rate (CTR)
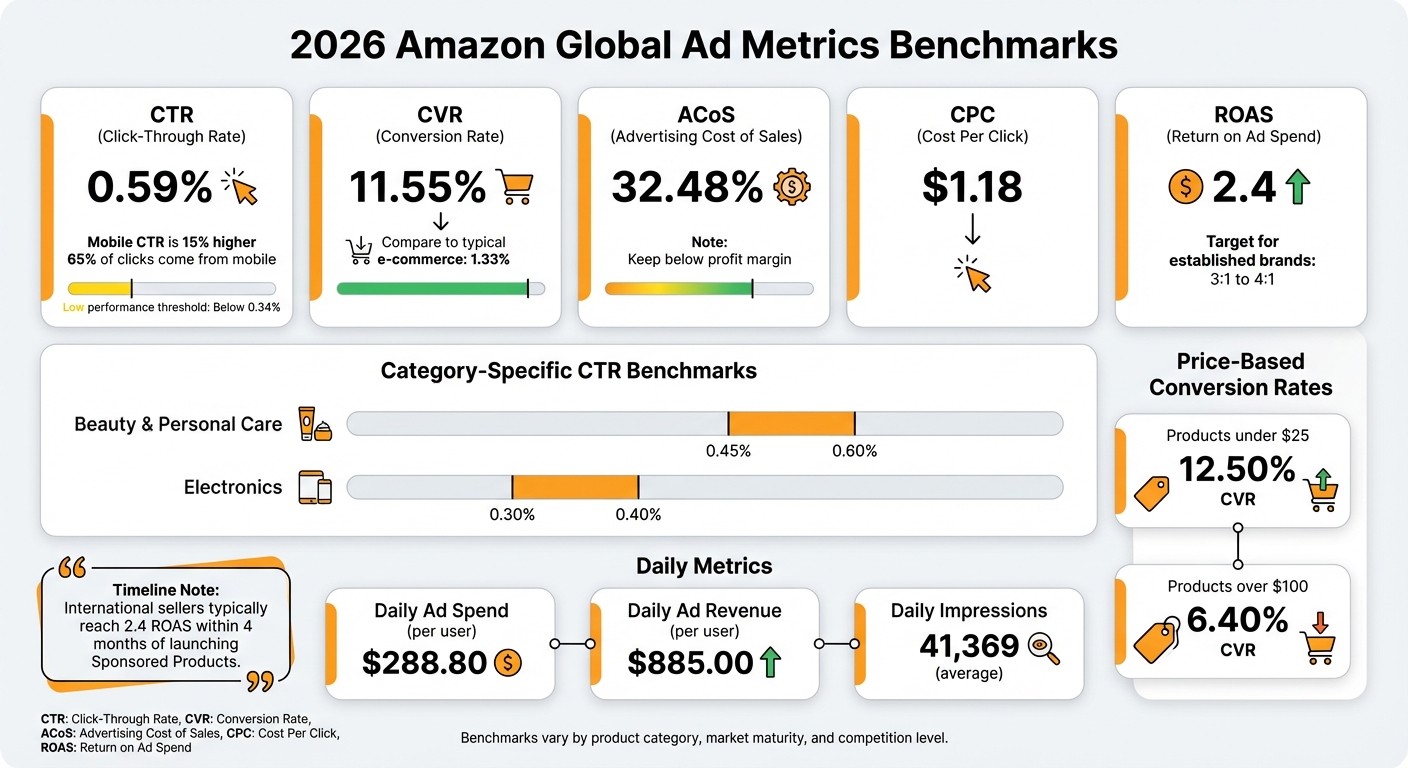
Impressions reflect how often your ad appears on a shopper’s screen, while reach shows how many unique users have seen it. These figures are crucial for assessing your brand’s visibility. By 2026, Amazon sellers are averaging 41,369 daily impressions, though this number varies depending on market size and competition.
Click-through rate (CTR) measures how effectively your ad engages local audiences. For Amazon in 2026, the average CTR is 0.59%. Mobile devices outperform desktops, delivering a 15% higher CTR and accounting for 65% of all clicks. If your CTR dips below 0.34%, it might be time to revisit your ad’s primary image, title, or keywords, or consider optimizing your product listing to improve engagement. For context, beauty and personal care products tend to achieve CTRs between 0.45% and 0.60%, while electronics hover between 0.30% and 0.40%. Evaluating how clicks translate into sales across regions can further refine your approach.
Conversion Rate (CVR) Across Different Markets
Conversion rate (CVR) tracks the percentage of ad clicks that result in a purchase. Amazon’s average CVR in February 2026 stands at 11.55%, significantly higher than the typical e-commerce site’s 1.33%. This reflects Amazon shoppers’ strong buying intent.
CVR can vary based on factors like pricing and region. Products under $25 achieve conversion rates around 12.50%, while those priced over $100 average closer to 6.40%. Local factors - such as brand recognition, customer reviews, and pricing strategies - play a major role in how well products perform in different markets.
Advertising Cost of Sales (ACoS) and Return on Ad Spend (ROAS)
Profitability metrics are just as important as engagement. ACoS calculates the percentage of your sales revenue spent on advertising. It’s determined by dividing ad spend by ad sales and multiplying by 100. In 2026, the average ACoS is 32.48%. For example, if your profit margin is 40% but your ACoS hits 45%, you’re losing money on each sale. Keeping ACoS below your profit margin is critical.
ROAS measures how much revenue your ads generate for every dollar spent. You calculate it by dividing ad revenue by ad spend. International sellers typically reach an average ROAS of 2.4 within four months of launching Sponsored Products. Established brands often aim for a ROAS between 3:1 and 4:1 for consistent growth. Amazon’s multi-country dashboard makes it easier to compare these metrics across regions, adjusting for differences in cost-per-click rates and tax structures.
Metric | 2026 Amazon Benchmark | What It Measures |
|---|---|---|
CTR | 0.59% | Percentage of impressions that result in clicks |
CVR | 11.55% | Percentage of clicks that lead to purchases |
ACoS | 32.48% | Ad spend as a percentage of sales revenue |
CPC | $1.18 | Average cost per click |
ROAS | 2.4 | Revenue earned per dollar spent |
These metrics are the foundation for evaluating and improving your international ad campaigns. They not only highlight what’s working but also point to areas where adjustments can lead to better results.
Advanced Metrics for Better Campaign Results
Once you've got the basics down, diving into advanced metrics can elevate your campaign performance, especially on a global scale. These data points highlight your competitive position, uncover customer acquisition trends, and provide regional benchmarks to refine your bidding and targeting strategies.
Search Term Impression Share
Search Term Impression Share (IS) reveals the percentage of ad impressions you captured out of the total you were eligible for over a 30-day period. For example, if your IS for "wireless headphones" in the UK is 40%, that means you're showing up in 40% of the opportunities, while competitors are taking the remaining 60%.
This metric is especially useful for spotting high-potential keywords in local markets and gauging your standing against regional competitors. Another related metric, Impression Rank (IR), tells you your position among advertisers for a keyword. An IR of 3 means you were third in impression count.
If a keyword has a high IR (1 or 2) but isn't converting well, it might be worth lowering your bid to conserve your budget.
On the flip side, for keywords with a low IR but high product relevance, increasing your bid could help improve visibility and capture more market share.
New-to-Brand Metrics for Finding New Customers
New-to-Brand (NTB) metrics track first-time orders and sales from customers who haven’t purchased from your brand on Amazon in the past year. This is particularly valuable for international campaigns, where growth often depends on attracting new buyers.
NTB data can help you calculate the cost of acquiring new customers in specific regions and pinpoint which localized keywords are most effective at drawing in fresh audiences. By identifying keywords with the highest percentage of first-time orders, you can allocate higher bids to those terms and drive new customer acquisition. These metrics are available for Sponsored Brands and Sponsored Display ads, but you’ll need to be enrolled in Amazon Brand Registry to access them.
2026 Benchmark Data for Global Ad Metrics
Benchmarks provide a clear frame of reference for evaluating your campaign's performance. Here's a look at projected 2026 averages for key Amazon advertising metrics:
Metric (Projected 2026) | Average Value |
|---|---|
Cost Per Click (CPC) | $1.18 |
Conversion Rate (CVR) | 11.55% |
Advertising Cost of Sales (ACoS) | 32.48% |
Click-Through Rate (CTR) | 0.59% |
Daily Ad Spend (per user) | $288.80 |
Daily Ad Revenue (per user) | $885.00 |
These figures will vary depending on factors like product category, market maturity, and competition. For instance, in newer markets, ACoS might be higher as you work on building visibility, while in mature markets, you should aim to match or exceed these benchmarks.
How to Track and Improve International Campaign Performance
Daily Tracking of Performance Metrics
Spending just 15–20 minutes daily to check key metrics can save you money and improve campaign efficiency. Focus on critical indicators like budget pacing, inventory levels, keyword indexing, and shifts in campaign performance. For example, if a campaign uses 75% of its budget by noon but maintains an ACoS below target, consider increasing the budget by 25–30% to capture evening traffic when activity peaks.
However, avoid making bid adjustments based on a single day's data. Amazon's 7–14 day attribution window often ties sales to earlier clicks, so reviewing at least a 14-day window ensures more accurate decisions. The only exception is if inventory is critically low - when stock falls below 20 units, reduce bids by 60% or pause the campaign entirely to avoid wasting money on clicks that can't convert.
Organizing campaigns into tiers based on ACoS performance can help prioritize your efforts:
Tier 1: Winners – ACoS is 10+ points below target. Monitor daily and increase the budget by 30–50%.
Tier 2: Stable – ACoS is within 5 points of target. Check every 2–3 days.
Tier 3: Needs Work – ACoS is 5–15 points above target. Make weekly optimizations.
Tier 4: Critical – ACoS is 15–25 points above target. Fix or pause campaigns within 48 hours.
Tier 5: Rebuild – ACoS is 25+ points above target. Pause these campaigns immediately.
This tiered system keeps you focused on where both time and budget will have the most impact. Additionally, every Wednesday, download your 7-day search term reports to identify negative keywords. Any term with 15+ clicks but zero orders could be draining your budget. Use an incognito browser to verify if your products are indexed for key terms - if they don’t appear in search results, pause your ads and address your listing SEO.
Once you’ve stabilized performance with daily checks, expand your approach by using advanced analytics tools for deeper insights.
Using Analytics Tools and Professional Services
Daily tracking provides quick wins, but advanced tools are essential for managing international campaigns effectively. While Amazon’s Ads Dashboard offers basic insights, it lacks features like hourly data, multi-country views, and predictive analytics. If your monthly ad spend exceeds $3,000–$5,000, it’s worth investing in professional analytics tools. Platforms like the Multi-Country Campaign Manager simplify tracking for international campaigns by consolidating data across regions.
Amazon Marketing Stream provides hourly metrics via API, allowing for quick adjustments when performance shifts during the day. This is especially useful for monitoring variations across time zones. Additionally, Amazon Attribution - available for free - tracks how external marketing efforts (like social media, email, or search ads) contribute to sales across international markets. Brands that optimize these channels have seen an 18% average increase in new-to-brand sales.
"Through Amazon Attribution, we have gained visibility into how our client's non-Amazon marketing investments impact their sales wherever they spend time. This insight is key to empowering our teams to drive greater return on investment."
– Josh Brisco, VP, Growth Media at Tinuiti
For sellers managing campaigns across regions like the US, UK, and Australia, full-service agencies such as eStore Factory can be game-changers. They offer proprietary tools and advanced analytics, combining real-time monitoring with market-specific strategies. Their PPC management services have helped sellers improve efficiency by 30–50% within just 90 days, addressing differences in competition, cost-per-click, and customer behavior across various regions.
Adapting Ad Strategies for Different Regions
Running uniform ad campaigns across regions can quickly drain your budget, especially when customer behavior, competition, and shopping habits differ from one place to another. What works in the United States might fall flat in the United Kingdom or Australia - not because your product isn’t appealing, but because your strategy doesn’t align with how shoppers in those regions search and make purchases.
One of the biggest pitfalls is treating international expansion as a simple copy-and-paste effort. Success metrics differ by region. For example, when entering a new market, you might see a higher initial Advertising Cost of Sales (ACoS) while building brand awareness. Over time, as customers become familiar with your products, performance tends to improve. Understanding these regional differences and fine-tuning your strategy is essential to turning international campaigns into profitable ventures. Without this tailored approach, you risk wasting ad spend and missing out on potential growth.
Tailoring Campaigns for US, UK, and Australia Markets
Customizing your campaigns to fit the unique dynamics of each market is critical. Even in English-speaking regions, search terms differ significantly. For instance, Americans search for "comforters", while shoppers in the UK and Australia look for "duvets." Similarly, "faucets" in the US are called "taps" elsewhere. Relying on direct translations won’t cut it - you need localized keyword research to understand how customers in each region search for products.
Competition levels also vary. The US market is highly competitive, often requiring bigger budgets and higher bids just to stay visible. By contrast, Australia’s marketplace, while less saturated, is still evolving and demands a growth-focused strategy. Pricing perceptions also differ: in the UK and Australia, taxes like VAT and GST are included upfront, while in the US, taxes are added at checkout. These differences can influence how shoppers perceive value and even impact your ACoS calculations. Seasonal trends are another layer to consider - summer products peak in December and January in Australia, while in the US and UK, these products see demand during mid-year months.
When launching in a new market, start with automatic targeting to let Amazon’s algorithms identify relevant local search terms without needing upfront translations. Use "Dynamic bids – down only" to keep costs in check while gathering valuable data. Every two weeks, review your search term reports to find high-performing keywords for manual campaigns. Don’t forget to aggressively apply negative targeting to exclude irrelevant brands or non-converting products.
Another key step is creating localized Brand Stores for each market. These stores help introduce your brand and build trust with new audiences. Research shows that shoppers who visit a Brand Store are 53.9% more likely to make a purchase and spend 71.3% more per order. Sponsored Brands Video campaigns linking to Brand Stores also see a 23% higher conversion rate compared to those that link to product detail pages. To make your Brand Store resonate, use lifestyle imagery that reflects the local environment - like UK-style power outlets or Australian outdoor settings - to create a stronger connection with shoppers.
How eStore Factory Helps with Market-Specific Campaigns
Navigating the complexities of regional ad campaigns can be challenging, especially when dealing with differences in competition, keywords, and shopping behaviors. That’s where eStore Factory comes in. Their PPC management services are designed to handle the unique demands of markets like the US, UK, and Australia. From localized keyword research and bid adjustments to creative tweaks that align with regional preferences, their team ensures your campaigns are optimized for success in each market.
Conclusion: Using Global Ad Metrics to Grow Your Business
Tracking the right metrics turns ad campaigns into a powerful growth tool rather than a guessing game. Keep an eye on CTR (Click-Through Rate), CVR (Conversion Rate), and ACoS (Advertising Cost of Sale) to spot inefficiencies and make informed adjustments to bids or keywords. By reviewing performance weekly, you can pause underperforming keywords and reallocate spending toward high-converting ones, ensuring your budget is used effectively. These metrics don't just show how you're performing - they help you stay ahead by enabling proactive changes.
"Advertising without tracking results is like driving blind, you won't know if you're on the right path or wasting money." – Francisco Valadez, VP of Brand Operations, My Amazon Guy
Thriving in global markets requires more than just tracking numbers; it calls for decisive action. Use biweekly search term reports to uncover high-performing keywords and weed out irrelevant ones. Set break-even ACoS targets that align with your product margins - lower targets for established items and higher ones for new launches. And don’t overlook New-to-Brand metrics, which reveal whether your campaigns are bringing in valuable new customers or just recycling repeat buyers.
If managing all this feels overwhelming, expert help can make a difference. Services like eStore Factory’s PPC management services provide localized keyword research, bid optimization, and creative tweaks to keep campaigns profitable as you expand internationally. Instead of spending months learning through trial and error, you gain access to proven, data-driven strategies that scale your business while maintaining a healthy ACoS.
The key to long-term success lies in consistent metric management. By tracking, testing, and refining your campaigns daily, you can outpace competitors. With more than 75% of Amazon sellers using PPC advertising, those who measure and optimize consistently are the ones who gain a competitive edge.
FAQs
What’s my break-even ACoS?
Your break-even ACoS (Advertising Cost of Sales) is the point where your ad spend matches your profit margin, meaning you're not losing or making money from ads. It's expressed as a percentage of ad spend relative to your sales price.
To find it, use this simple formula: divide your unit profit by your sales price.
For instance, if you're making $3 profit per unit and your product's sales price is $20, your break-even ACoS would be:
$3 ÷ $20 = 0.15 or 15%
This means you can spend up to 15% of your sales price on ads without cutting into your profits.
How do I compare ROAS across countries?
To effectively compare ROAS (Return on Ad Spend) across different countries, it's crucial to standardize both revenue and ad spend data. Start by working with the local currencies for accuracy, then convert everything into a common currency like USD. This approach helps eliminate distortions caused by currency fluctuations.
Beyond currency, remember that local market factors play a big role. Things like consumer behavior and advertising costs can vary widely by region, directly impacting ROAS. For instance, what works in one market might not perform the same in another.
Tools like Amazon’s international advertising features can simplify this process. They provide localized reporting, allowing sellers to analyze and compare ROAS across regions with greater precision. These insights can help you make smarter decisions when scaling your campaigns globally.
When should I increase or pause budgets?
Adjusting budgets based on how your campaigns perform is key to getting the most out of your PPC efforts. For campaigns that are delivering strong results, consider increasing budgets by scaling up effective keywords and refining ad placements. At the same time, it’s important to regularly monitor performance - ideally on a weekly basis. This allows you to fine-tune bids and strategies, ensuring your budget is spent wisely and avoiding unnecessary waste.